Advanced features of MS Excel for data analysis
Introduction
While many people use Excel for basic tasks such as creating tables or performing simple calculations, the software also offers a wide range of advanced features that make it a robust tool for analysing large datasets, visualizing trends, and drawing meaningful conclusions. These advanced features allow users to work more efficiently, uncover hidden patterns, and make data-driven decisions. Understanding and applying these features can greatly enhance the productivity of data analysts, managers, researchers, and other professionals who rely on data to guide their work.
Pivot Tables
A pivot table allows users to summarize, organize, and explore data interactively. With just a few clicks, large volumes of data can be grouped, filtered, and aggregated in different ways, enabling users to spot trends and compare values easily. For example, in a sales dataset, a pivot table can be used to show total sales by region, by product category, or by salesperson, and users can drill down into specific details when necessary. Pivot tables can also be customized with calculated fields, filters, and slicers to further refine the analysis. The simplicity of creating a pivot table combined with its analytical power makes it one of Excel’s most valuable tools for data analysis.

Pivot Charts

Closely linked to pivot tables are pivot charts, which provide a dynamic way to visualize the data summarized in a pivot table. These charts automatically update when the pivot table data is filtered or rearranged, ensuring that the visual representation always reflects the current state of the analysis. This feature is especially useful when presenting findings to others, as charts can make complex data easier to understand at a glance. Excel offers a wide range of chart types—such as bar charts, line graphs, pie charts, and scatter plots—which can be used in combination with pivot charts to highlight different aspects of the data.
Power Query

Another powerful feature of Excel for data analysis is the use of Power Query. With Power Query, users can clean and shape data through operations such as removing duplicates, splitting columns, filtering rows, merging tables, and changing data types. The transformations applied through Power Query are recorded as steps and can be refreshed automatically if the underlying data changes. This makes it easy to maintain accurate and up-to-date analyses without repeating manual work.
Power Pivot
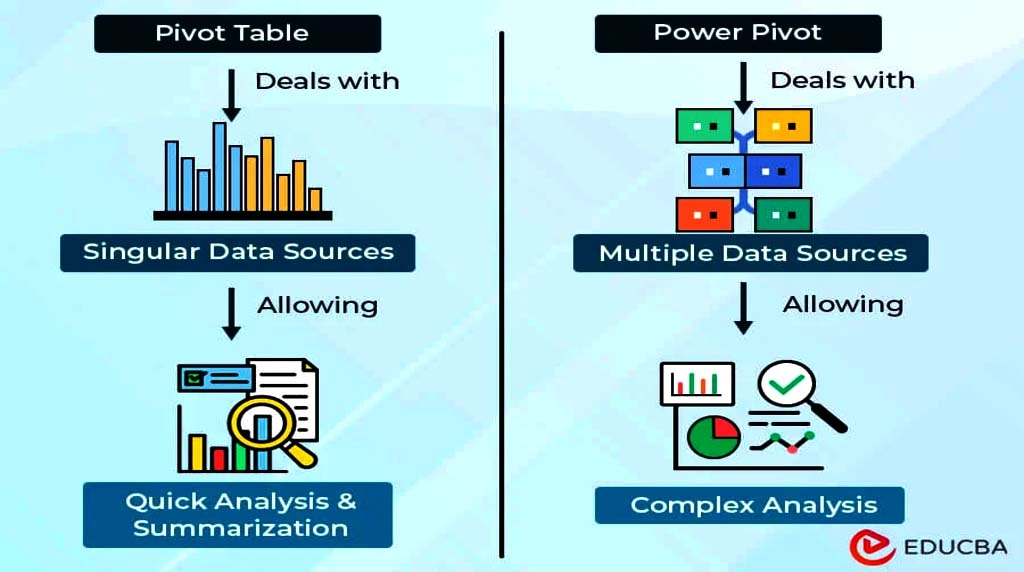
Excel also provides Power Pivot, an advanced data modeling tool that enhances the capabilities of pivot tables by allowing users to work with larger datasets, build relationships between different tables. This enables more advanced analyses, such as calculating year-over-year growth, creating measures for key performance indicators (KPIs), or performing advanced time intelligence functions. Power Pivot helps bridge the gap between traditional spreadsheet use and business intelligence tools, bringing enterprise-level data analysis capabilities directly into Excel.
Conditional Formatting
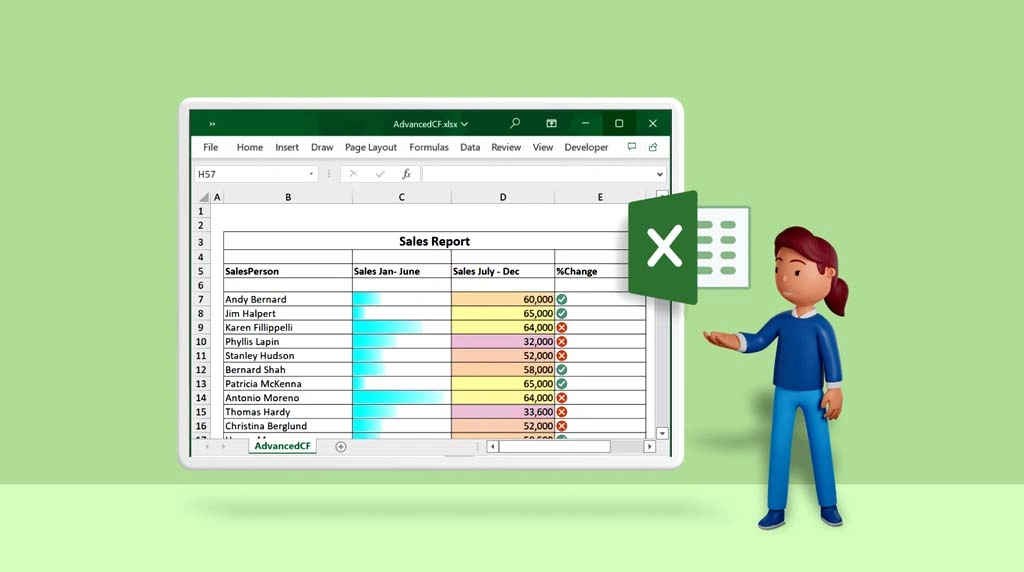
With conditional formatting, users can apply colour scales, data bars, and icon sets based on the values in their cells. For example, sales figures might be highlighted in green if they exceed a target, yellow if they are close to the target, and red if they fall below expectations. This immediate visual feedback makes it easier to spot areas that require attention or action. Conditional formatting can also be used to highlight duplicates, apply custom formulas, or create heat maps for enhanced data visualization.
Analysis

These tools are particularly useful in forecasting, budgeting, and strategic planning. For instance, Goal Seek allows users to determine what input value is needed to achieve a specific result, while Scenario Manager can be used to compare different sets of assumptions or plans. Data Tables enable the examination of how varying one or two variables influences a formula’s result across a range of values.
Conclusion
Microsoft Excel provides a wide array of advanced features that empower users to perform in-depth data analysis efficiently and effectively. From pivot tables and Power Pivot to Power Query, conditional formatting, and What-If Analysis tools, these features help users organize data, uncover insights, and support data-driven decision-making. For professionals who rely on data, mastering these tools can significantly enhance the quality and impact of their analytical work.
1. What is Power Query, and why should I stop using "Copy-Paste"?
Power Query is an ETL (Extract, Transform, Load) tool. Instead of manually cleaning data (removing duplicates, fixing dates, or merging files), you record these steps once.
- The Benefit: When you get new data next month, you simply hit “Refresh,” and Excel performs all those cleaning steps automatically in seconds.
- Pro Tip: Use the “Clean Data” feature, which uses AI to automatically detect and fix formatting inconsistencies across thousands of rows.
2. How does Power Pivot handle "Big Data"?
Standard Excel is limited to about 1 million rows. Power Pivot uses an internal database engine that can handle tens of millions of rows without crashing your computer. It allows you to create a “Data Model,” linking different tables (e.g., Sales and Products) so you never have to write a VLOOKUP again.
3. What is DAX and how does it differ from standard formulas?
DAX (Data Analysis Expressions) is the formula language for Power Pivot. It is more powerful than standard Excel formulas, allowing for “Time Intelligence.” For example, you can compare “Total Sales” to “Same Period Last Year” with a single short formula that works regardless of how you filter your report.
4. Does Excel really have Python now?
Yes. You can now type =PY into a cell and write Python code directly within the grid.
- Why use it? Python libraries like Pandas for data manipulation and Matplotlib or Seaborn for advanced statistical plots (like Heatmaps or Violin Plots) allow for analysis that was previously impossible in Excel.
- Execution: The code runs in the Microsoft Cloud, returning the results or visualizations directly to your sheet.
What is the advantage of using LAMBDA functions?
Historically, if you had a complex calculation, you had to copy-paste it everywhere or use VBA (macros). LAMBDA allows you to create your own custom, reusable functions using standard Excel syntax.
- Benefit: You can turn a complex, 5-line formula into a simple name like =CalculateTax(A2). This makes your workbooks much cleaner and easier for others to audit.